By Maria J. Morocho
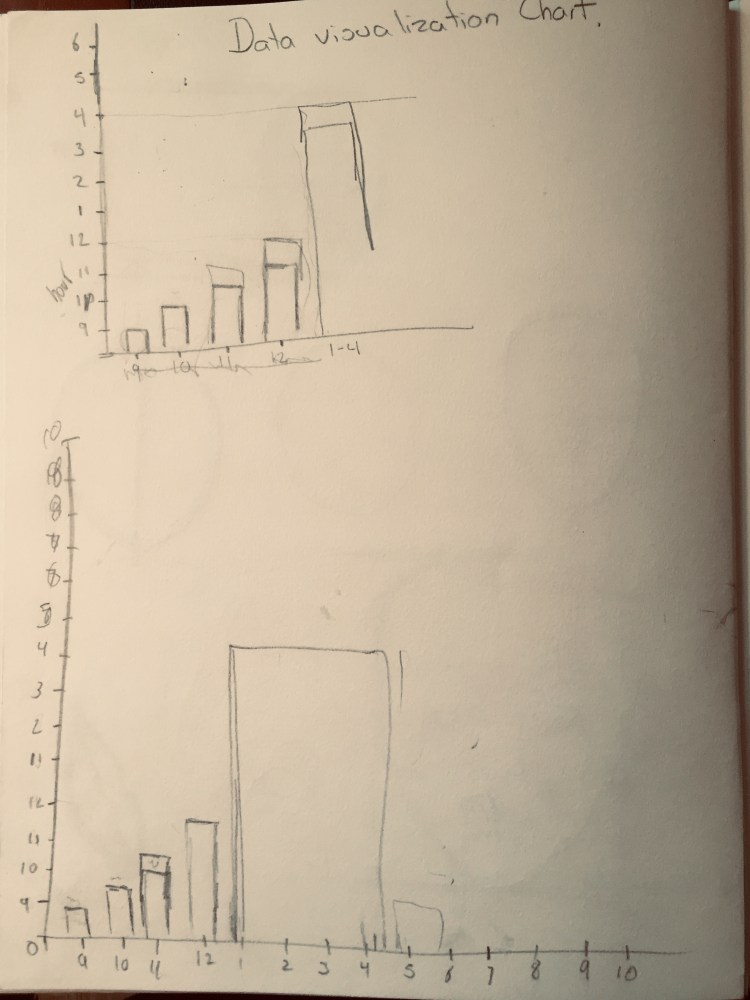
What is data visualization?
A data visualization is the presentation of data in illustrated or graphic format. Because of the way the human brain processes information, using diagrams or charts to visualize large amounts of complex data is easier than spreadsheets or reports.
Materials and Research
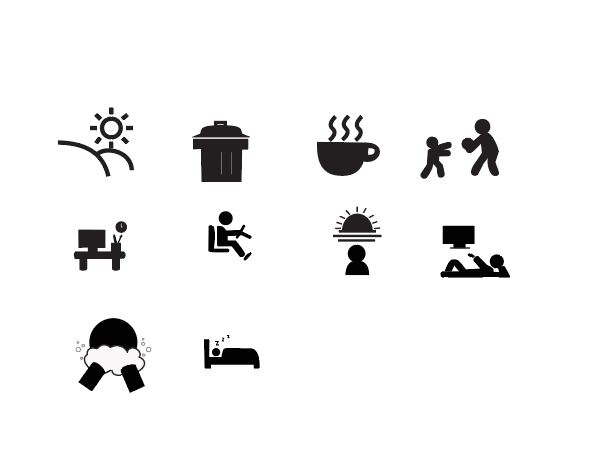
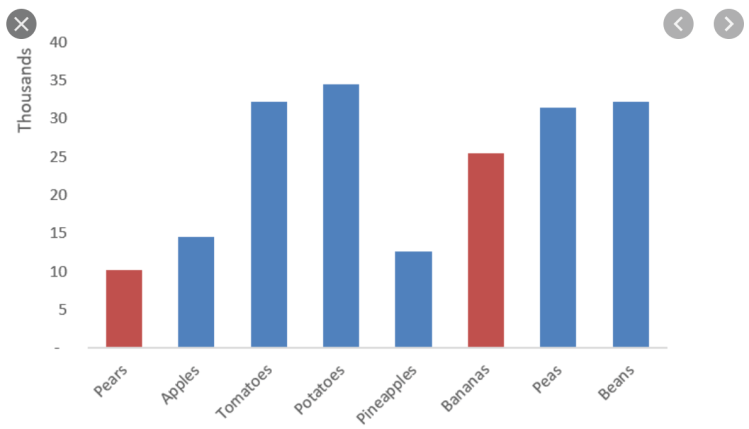
Professor Krikun provided us with some examples of data charts. I looked through all of them to get some inspiration. then I googled “data chart” and I found many types. I choose the bar chart as a model and I started to trace it in illustrator. I gathered information of My Day in My Life and my Icons that I previously did in illustrator.
Strategy
I looked for a lot of inspiration. not only charts but also random images that could use for inspiration. I carefully chose the colors that’ll look pleasant to the viewers eyes.
Challenges
I was very undecided in what chart to choose because there were many options. I chose a bar chart and after I was done, I was not satisfied with it. So, I did a new chart.
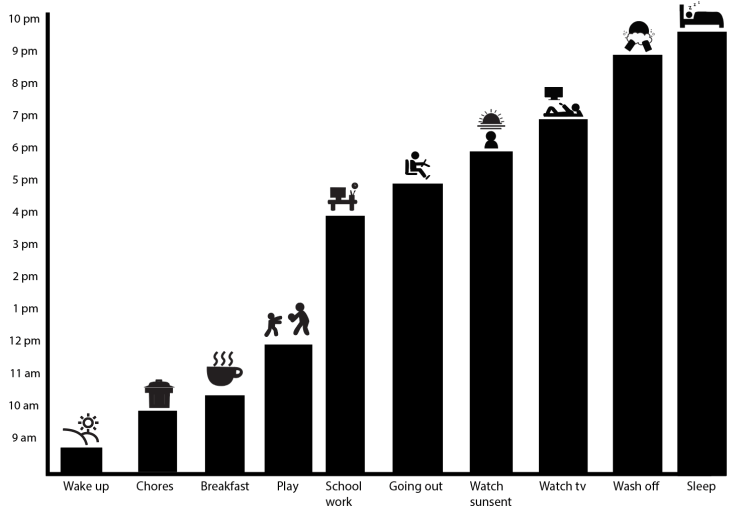
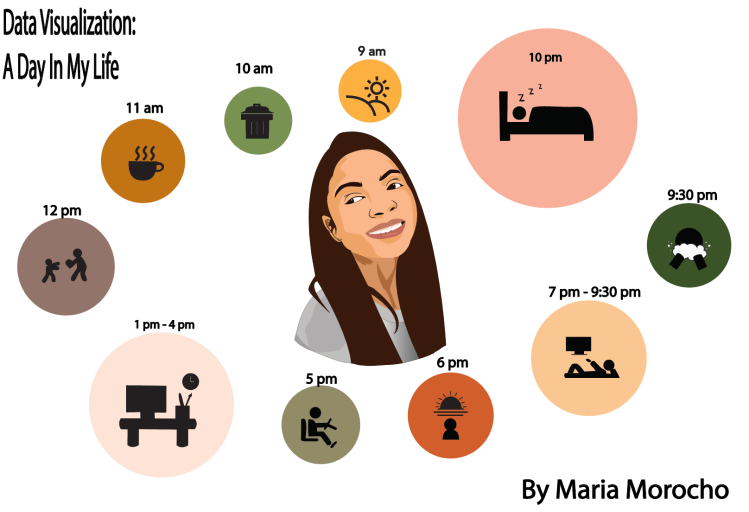
Final result
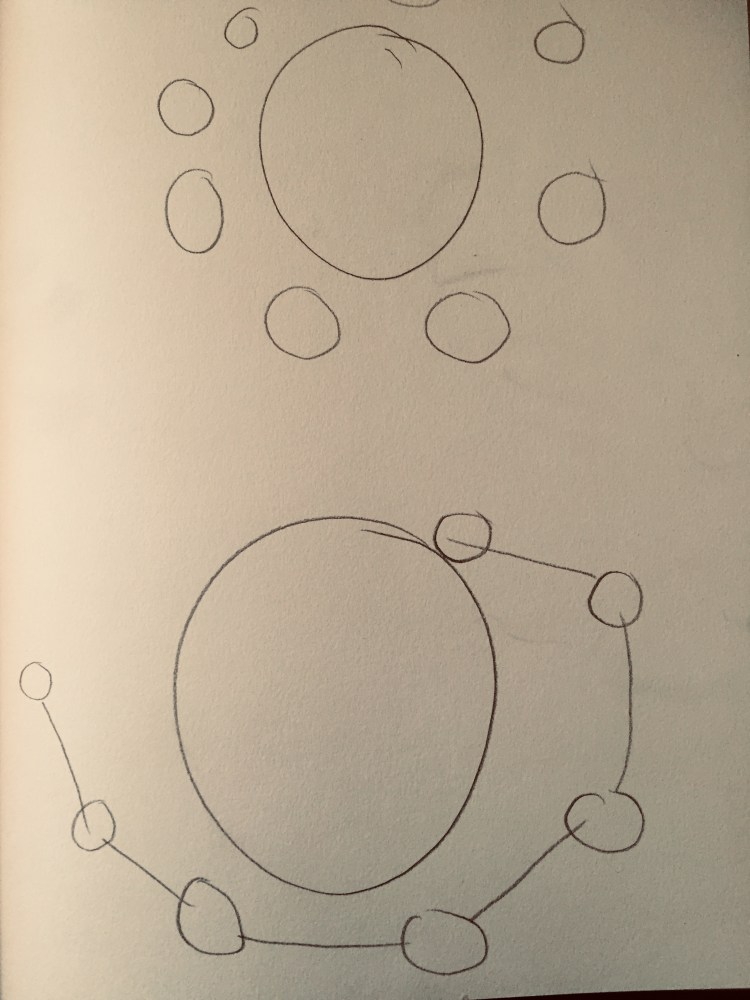
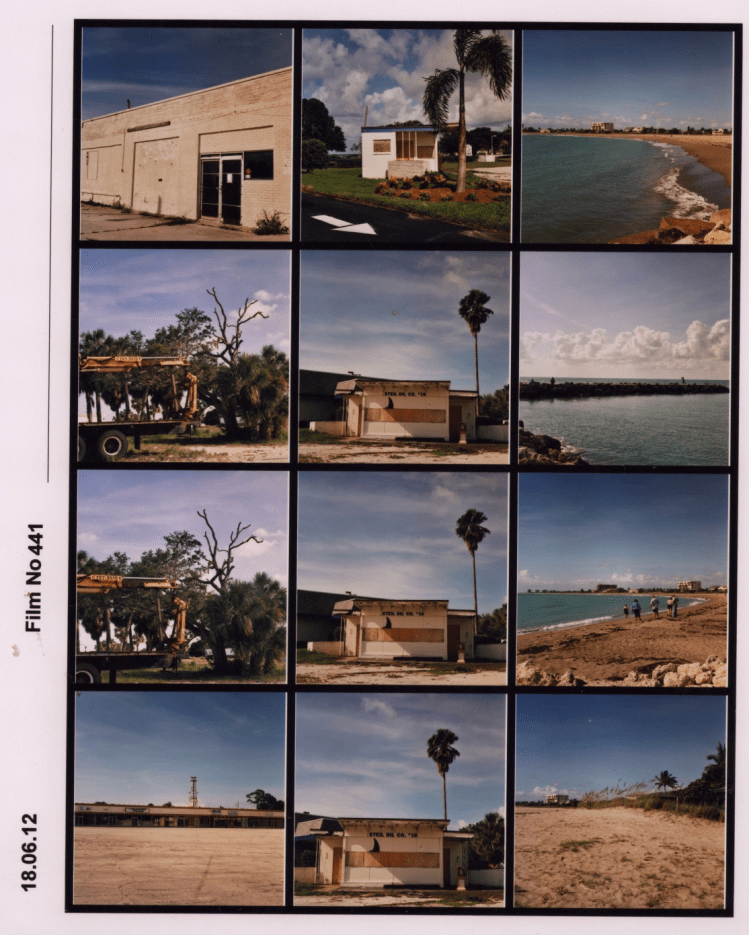
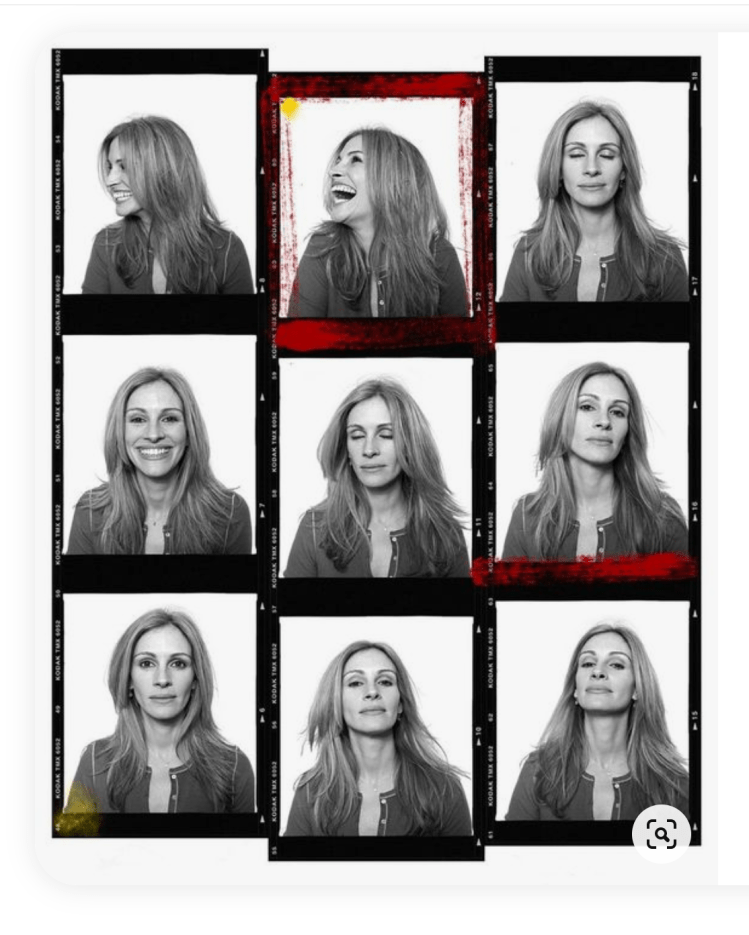
What is a contact sheet?
A piece of photographic paper onto which several or all of the negatives on a roll of film have been contact printed. A contact sheet provides a lot of information about a certain photo shoot.
Materials and Research
First, I used Adobe Bridged to manage all my images. I gathered more than 20 selfies and I chose the ones that seem to have more in common. Then I transfer all my images to photoshop. I fixed the light, color and size for each one them. I eded up having 12 selfies and I arranged them in three columns by 4 rows. Finally, I looked for a Kodak frame and I put it on the sides of each column.

Strategy
I changed all my images to black and white to have a value scale. I wanted to make my contact sheet as something from the past. And I thought that black and white is still being a throwback to the photographic past.
Challenges
I had some difficulty in fixing the light of some of my pictures. Many of them were very dark but professor Krikun taught me how to fix them.
Final result

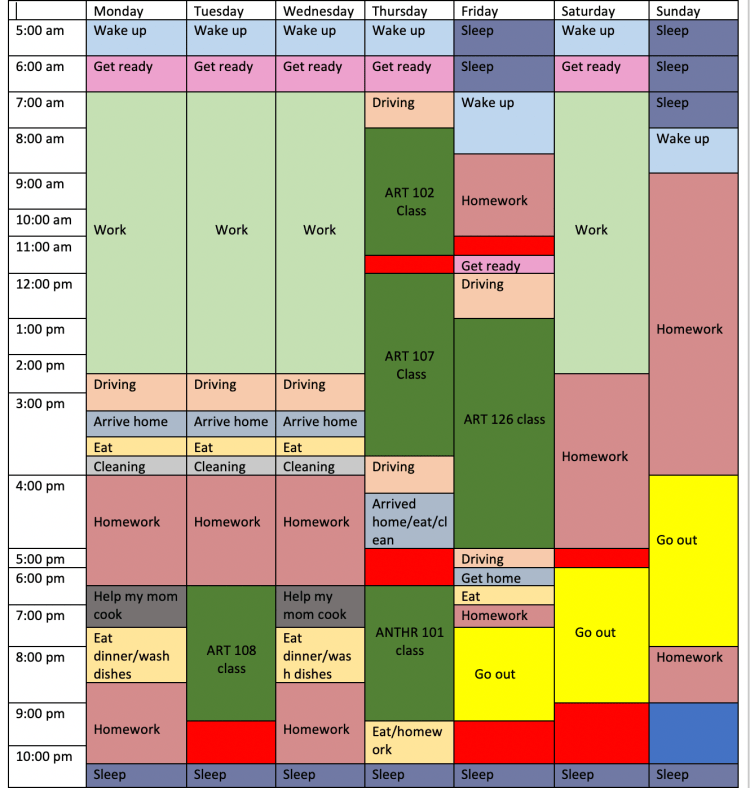
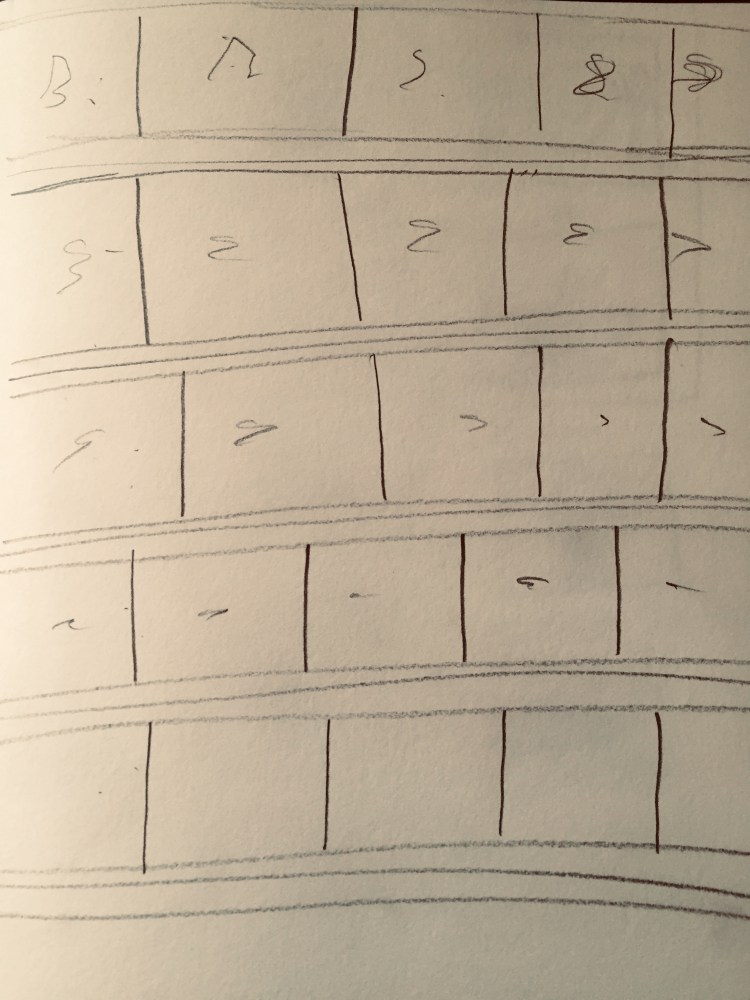
What is time management table?
The time management Grid or table is a great way to organize your schedule and find time to do the things you want to do. Depending on how often your regular schedule changes the Time Management grid could be filled out on a weekly, monthly or quarterly basis.
Materials and Research
I used Microsoft Word to create a chart that shows how a regular week in my life looks like. I wrote down all the things that I do in a week and I put them under their correct day and time.
Strategy
In my time schedule I have different colors for activity that I do in a day. professor Krikun told us that having different colors for each activity will help the viewer understand more.
Final Product